Energy production and consumption
| Energy is a really complex and controversial topic. Generally speaking, the availability of energy has transformed the course of humanity over the last few centuries. Not only have new sources of energy been unlocked – first fossil fuels, followed by a diversification to nuclear, hydropower and now other renewable technologies – but also in the quantity we can produce and consume. In order to give you a general overview, we would like to structure this introduction around three different basic questions:
|
 |
The Energy Mix
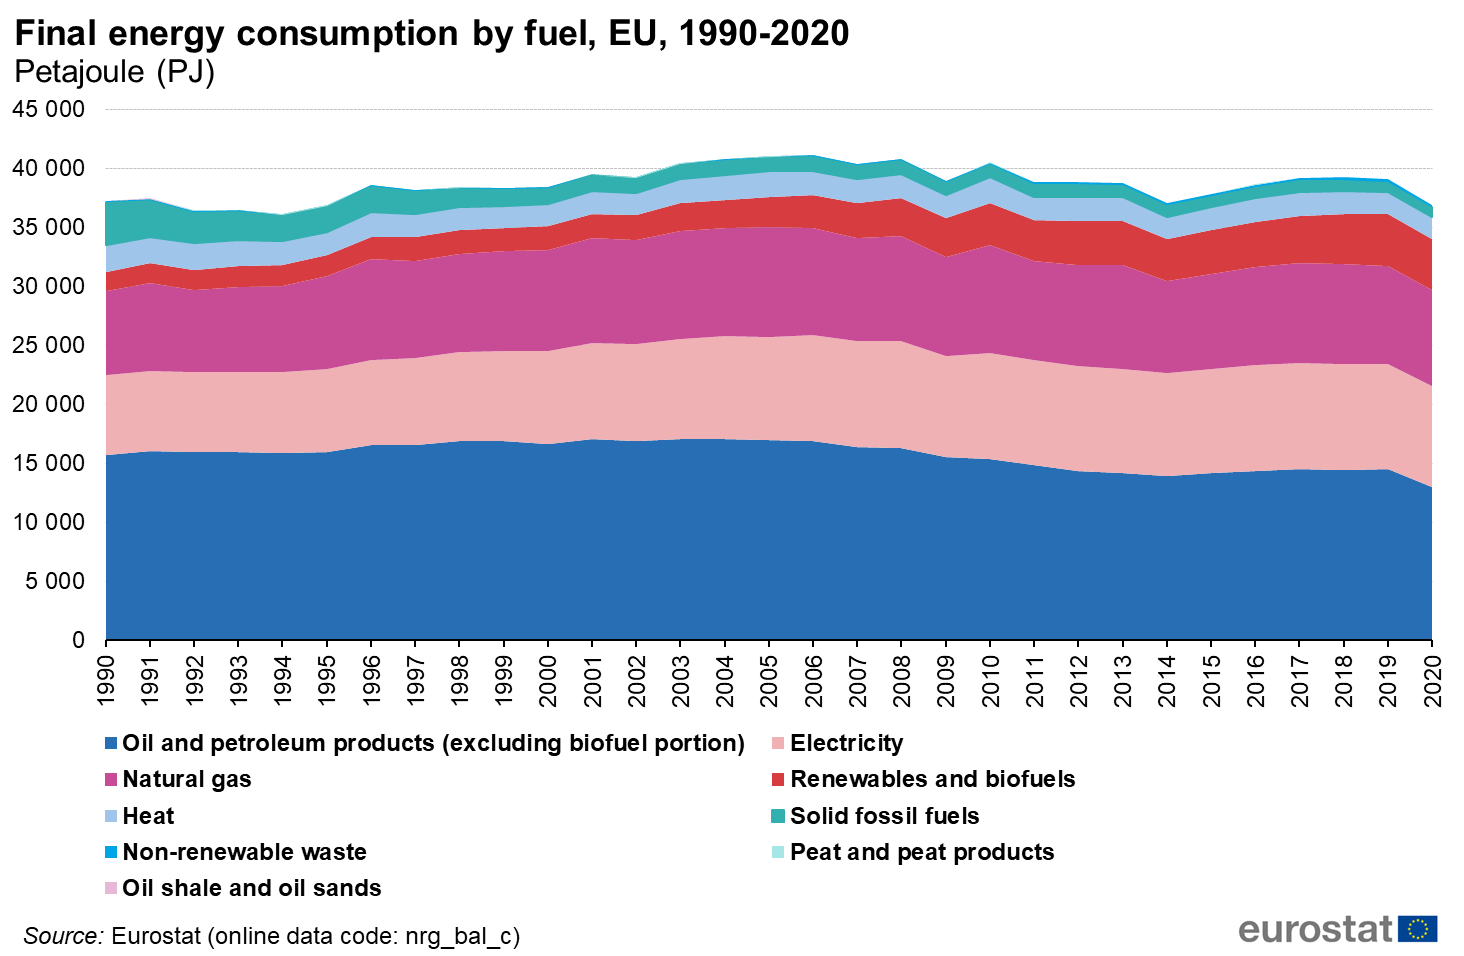
In order to analyse the second question (How do we produce this energy?) let's now have a look at the final energy consumption by fuel.
To be able to understand the following graphs and statistics, let's have a quick look at what the energy mix in the EU is made of:
 Source: LINK
To be able to understand the following graphs and statistics, let's have a quick look at what the energy mix in the EU is made of:
- Oil and petroleum products are products derived from crude oil (e.g. refinery gas, gasoline, gas/diesel oil etc.).
- Natural gas is a naturally occurring mixture of gaseous hydrocarbons consisting primarily of methane.
- Electricity is an alternative fuel that can be used to power all-electric and plug-in hybrid cars. Powering vehicles with electricity can be cost-effective and can have significant energy security and emissions benefits.
- Solid fossil fuel means solid fuel other than biomass, including anthracite and dry steam coal, hard coke etc.
- Renewable energy is energy derived from natural sources that are replenished at a higher rate than they are consumed.
| As you can see in the following graph, between 1990 and 2020 the amount and share of solid fossil fuels in final energy consumption dropped significantly (from 9.6 % in 1990 to 3.6 % in 2000, 2.8 % in 2010, and 2.1 % in 2020). On the other hand, renewable energy sources increased their share in the total, moving from 4.3 % in 1990 to 5.3 % in 2000 and 8.8 % in 2010, finally reaching 11.8 % in 2020. Natural gas remained quite stable over this period, ranging from 18.8 % (in 1990) to 22.6 % (in 2005), its share in the total equalling 21.9 % in 2020. Oil and petroleum products accounted for the biggest share (35.0 %) in the structure of final energy consumption in 2020, followed by electricity (23.2 %), and natural gas (21.9 %). Solid fossil fuels contributed only 2.1 % to the final energy consumption at the end-use level. |
 |
How much energy do we consume?
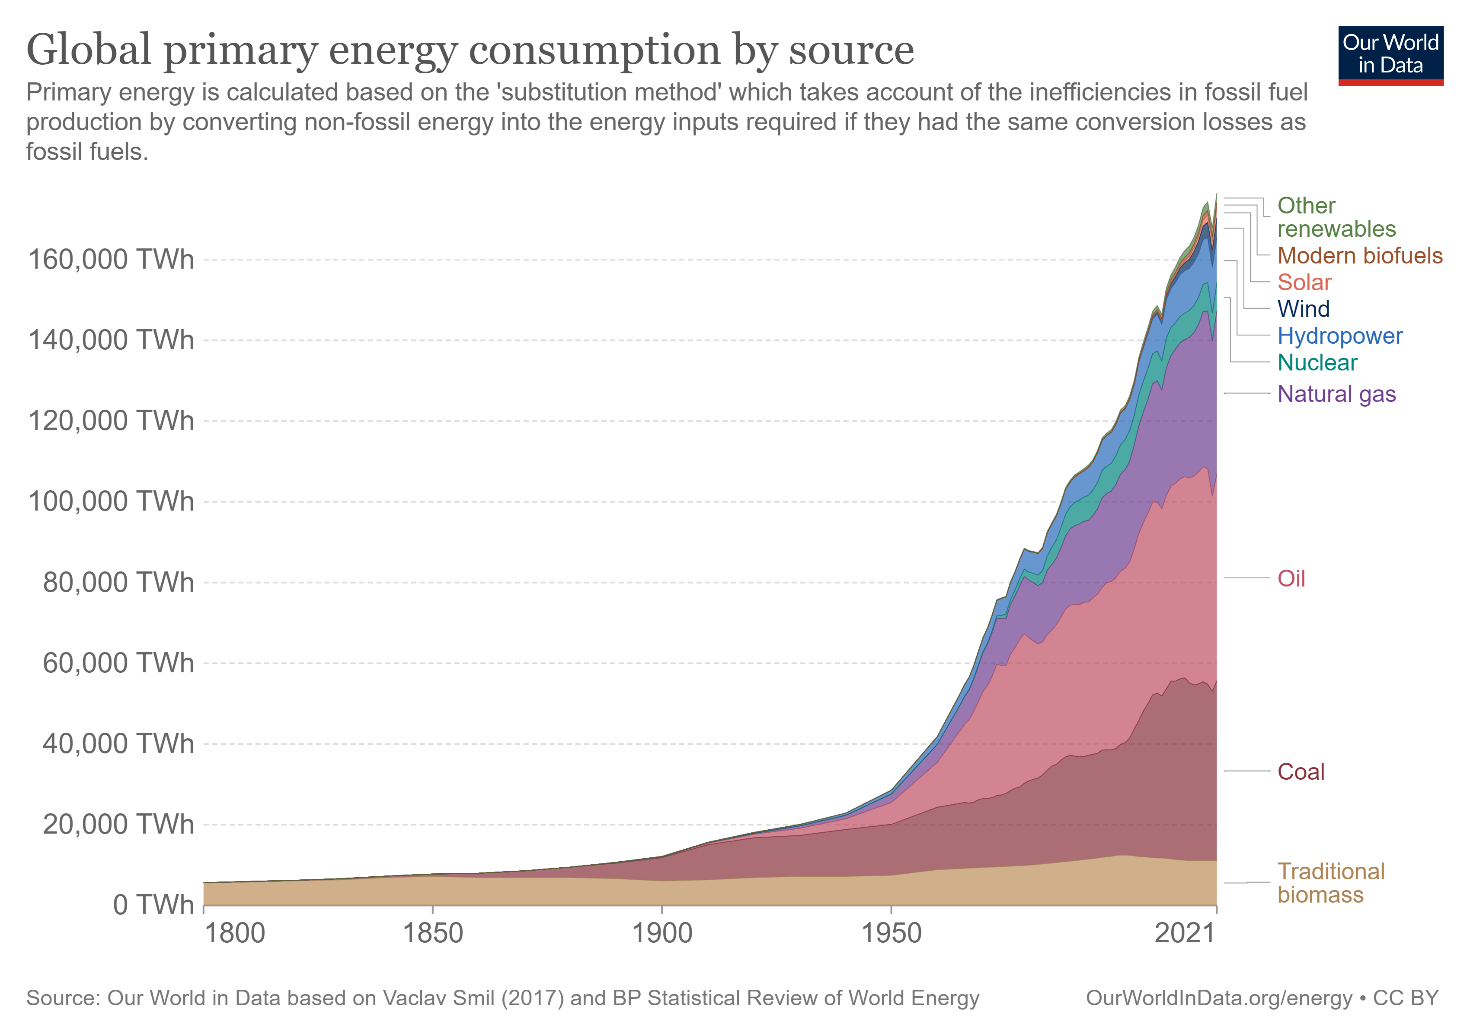
Regarding the first question, as you can see in the chart below, global energy consumption has skyrocketed especially since the 1950s. We see that global energy consumption has increased nearly every year for more than half a century. The exceptions to this are in the early 1980s, and 2009 following the financial crises and 2020 in relation to the COVID 19 pandemic. LINK

How much energy does each of us consume?
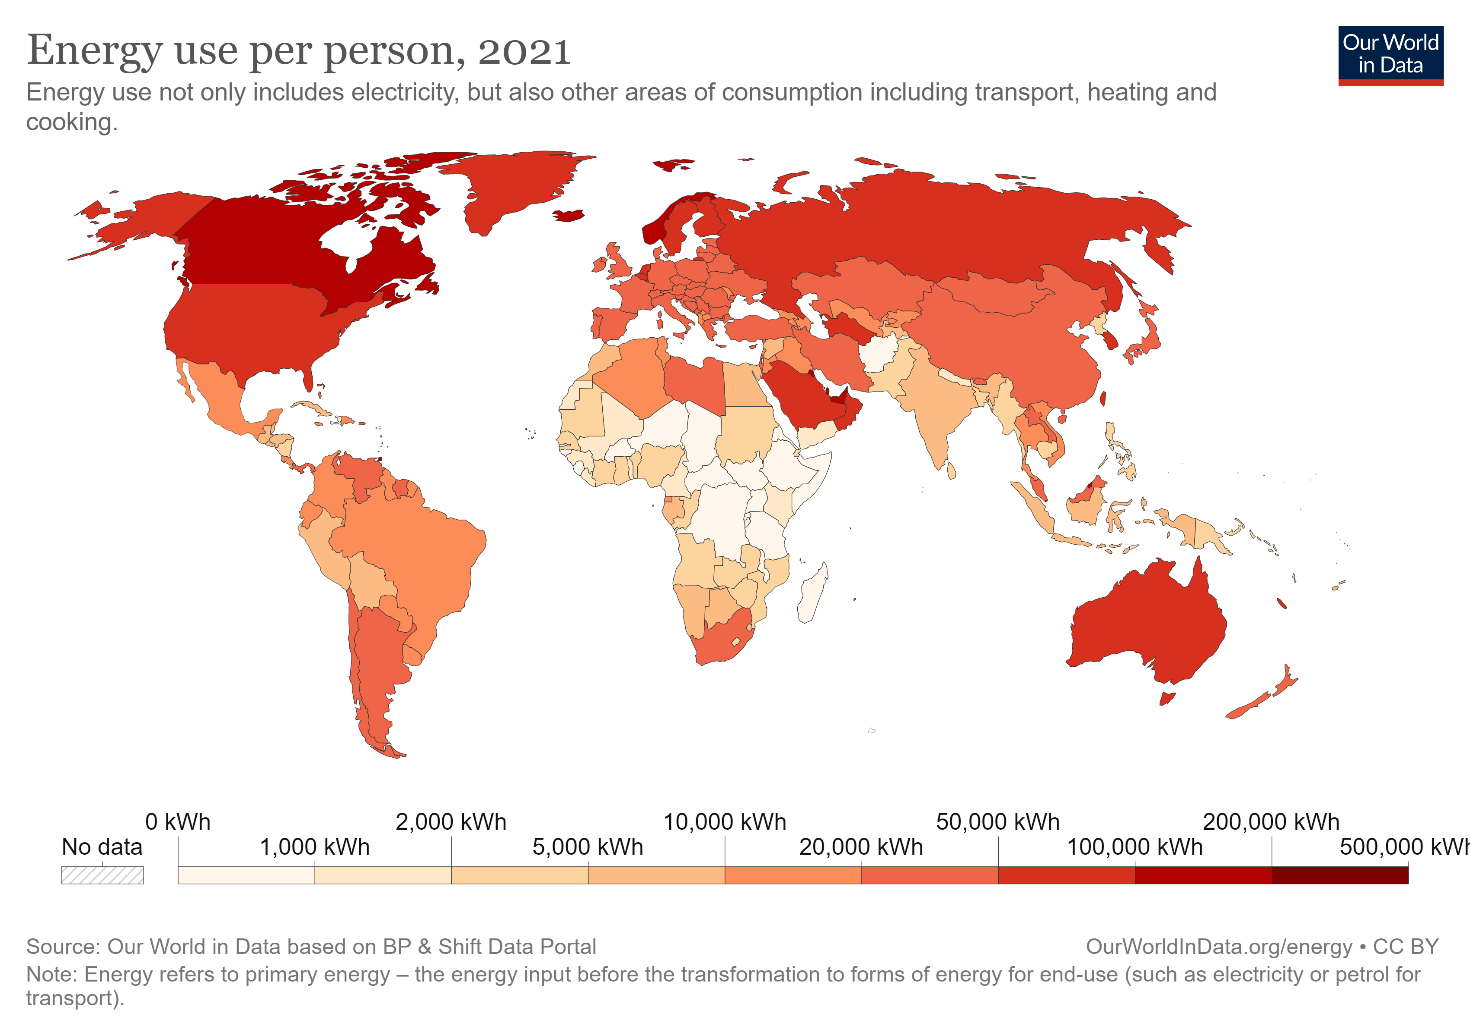
 On the following map you can see the energy use per person in 2021. As you can see, and generally speaking, economically more developed countries have a higher energy use per person. This means that there is a correlation between GDP per capita and energy consumption. Accordingly, as countries develop economically, energy consumption per person increases. LINK

And in the EU?
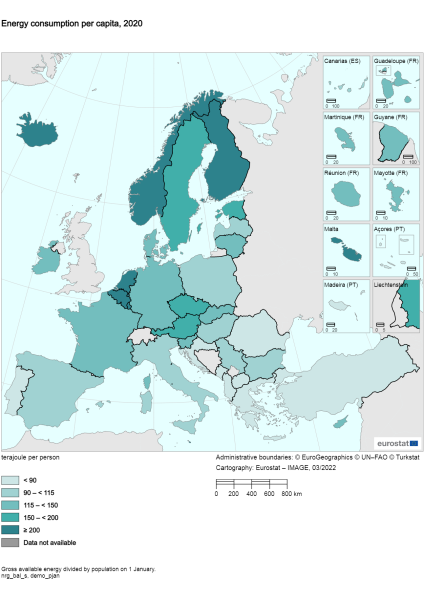
Now, let's have a closer look at the Energy Consumption within the European Union. Again, you can see a correlation between GDP and Energy Consumption. Nevertheless, you can also see that there are other factors that impact the statistics, as the North-South difference might insinuate:
Climate and energy consumption are closely related: Climate impacts the amount of energy we consume; the amount of energy we consume has an impact on climate change. LINK

“Final Energy consumption”
Final energy consumption in the EU in 2020 amounted to 37 086 PJ, 5.6% less than in 2019. Final energy consumption is the total energy consumed by end users, such as households, industry and agriculture. It was slowly increasing from 1994 until it reached its highest value of 41.445 Mtoe (Millions of tonnes of oil equivalent) in 2006. By 2020 final energy consumption decreased from its peak level by 10.5%.
 On the following map you can see the energy use per person in 2021. As you can see, and generally speaking, economically more developed countries have a higher energy use per person. This means that there is a correlation between GDP per capita and energy consumption. Accordingly, as countries develop economically, energy consumption per person increases. LINK
Now, let's have a closer look at the Energy Consumption within the European Union. Again, you can see a correlation between GDP and Energy Consumption. Nevertheless, you can also see that there are other factors that impact the statistics, as the North-South difference might insinuate:
Climate and energy consumption are closely related: Climate impacts the amount of energy we consume; the amount of energy we consume has an impact on climate change. LINK
Source: LINK
“Final Energy consumption”
Final energy consumption in the EU in 2020 amounted to 37 086 PJ, 5.6% less than in 2019. Final energy consumption is the total energy consumed by end users, such as households, industry and agriculture. It was slowly increasing from 1994 until it reached its highest value of 41.445 Mtoe (Millions of tonnes of oil equivalent) in 2006. By 2020 final energy consumption decreased from its peak level by 10.5%.
